We present the UTUAV dataset which consists of three
different scenes captured in the second largest city of
Colombia: Medellín. Road user classes representative of those
in emerging countries such as Colombia, have been chosen:
motorcycles (m), light vehicles (c) and heavy vehicles (b).
HOT NEWS!:
We invite people to use this dataset and to improve upon the
baselines presented here (see under Results)
and submit a paper with your results to the IEEE 16th
International Conference on Pattern Recognition Systems (ICPRS-27). The
current deadline for papers is the 25th October 2026. The
conference will take place at Bordeaux (France) on 8-11 March
2027. Accepted and presented papers are planned to be
published by the IEEE (Xplore).
The dataset was initially annotated by means of Viper
annotation tool. Subsequently, the annotations were converted
to the Pascal
VOC (XML) format (directories named "Annotations",
bounding boxes in absolute coordinates xmin, xmax, ymin, ymax)
and to Ultralytics
YOLOv8 format (directories named "labels", class label
(0: m, 1: c, 2: b followed bounding boxes in normalised xywh
coordinates relative to image width and height: xcentroid,
ycentroid, width, height). The images are stored in
directories named "images".
Publications:
If you use these datasets please cite the following publication:
@article{felipe2025utuav,
  title={UTUAV: A Drone Dataset for Urban Traffic Analysis},
  author={Felipe, Lepin and Velastin, Sergio A and Le{\'o}n, Roberto and Jes{\'u}s, Garc{\'\i}a-Herrero and Rojas-Mart{\'\i}nez,
Gonzalo and Espinosa-Oviedo, Jorge Ernesto},
  journal={Drones},
  volume={10},
  number={1},
  pages={15},
  year={2025},
  publisher={MDPI AG}
}
@article{espinosa2020detection,
  title={Detection of motorcycles in urban traffic using video analysis: A review},
  author={Espinosa, Jorge E and Velast{\'\i}n, Sergio A and Branch, John W},
  journal={IEEE transactions on intelligent transportation systems},
  volume={22},
  number={10},
  pages={6115--6130},
  year={2020},
  publisher={IEEE}
}
Researchers can use these datasets provided that is only for
research, not commercial, purposes. To access these datasets
please contact Prof.
Sergio A Velastin with your name, institution and purpose
of your research.UTUAV-A Dataset (road side)
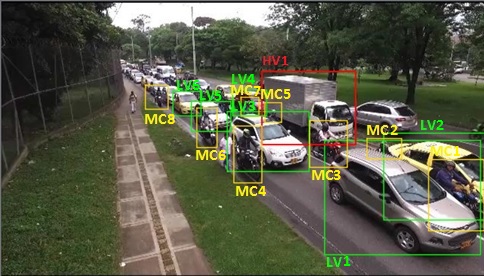
This dataset corresponds to an extension of Espinosa et al. dataset, which originally contained only annotated motorbikes in 10,000 frames with a resolution of 640x364 pixels. The extension includes the annotation of light and heavy vehicles. The images were taken from an unmanned air vehicle (UAV), elevated 4.5 meters from the ground. The UAV is kept at the same position and small movement of the camera cab be noticed.
WARNING: We no longer work with this dataset. You can see further details in version 1 of the UTUAV dataset , that is no longer maintained and we cannot guarantee that it is up to date).
 |
Bird-eye Datasets
Currently, we are concentrating on the following two sets
("B" and "C") which are of bird-eye views of urban
traffic taken from two different (but similar) heights for two
different road topologies. These sets are useful to experiment
with:
- Detection methods able to detect both very small and larger objects.
- Measuring generalisation capabilities e.g. how a model trained on B performs with images from C and vice versa.
UTUAV-B Dataset
Exploiting the top view angle that a high elevation UAV could reach (approx 100 meters), this dataset is composed of 6,500 labelled images with a resolution of 3840x2160 (4k) pixels. The entire sequence is captured with a top view. The visualisation colors for the annotated bounding boxes (see pictures below) are red for light vehicles (c), blue for motorbikes (m) and green for heavy vehicles (b). Note that this visualisation does not show stationary vehicles.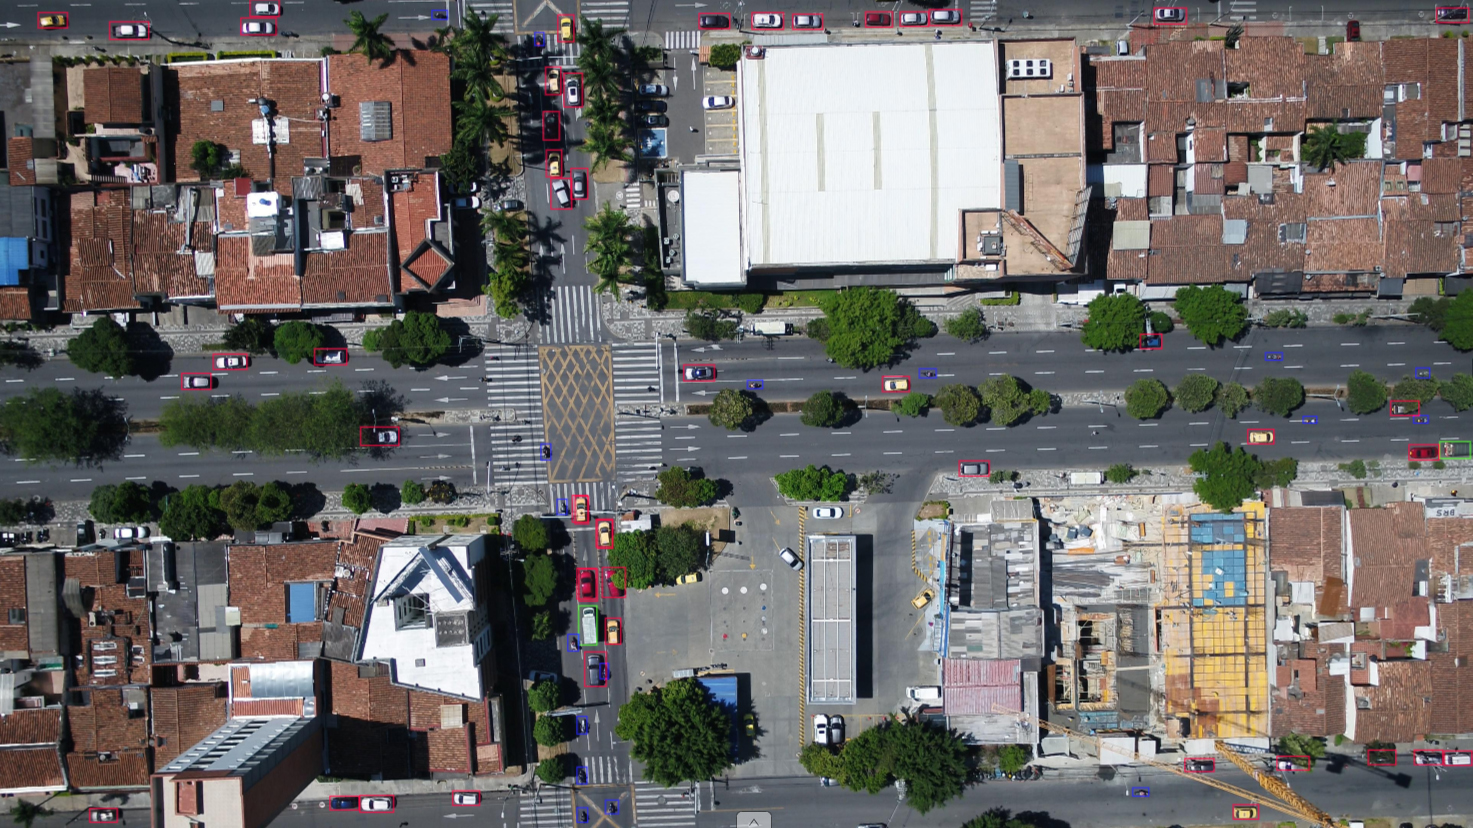
Annotated Image (4K resolution - Here resized) of UTUAV-B Dataset
UTUAV-C Dataset
This dataset came from a sequence of 10,560 frames, of which 6,600 are annotated, with a resolution of 3840x2160 (4k) pixels. This video sequence was also captured from an UAV, elevated at 120 meters from the ground. The road configuration is different. These differences have been introduced intentionally to test generalisation ability e.g. of detection on this dataset using a model trained with UTUAV-B. This dataset also uses a top view angle and uses the same color code for annotations as per UTUAV-B. Note that the visualisation does not show stationary vehicles.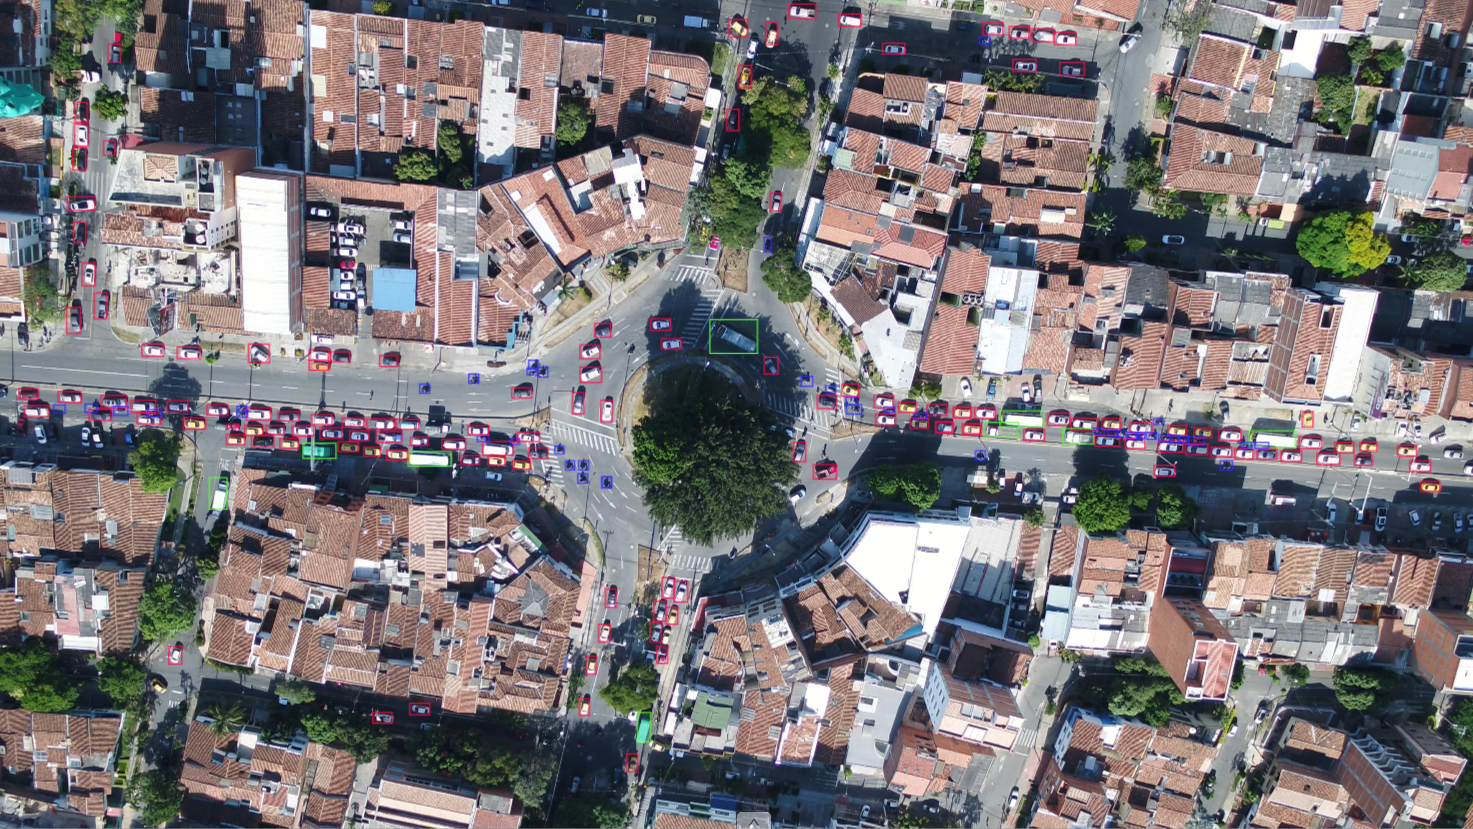
Version 2
Version 2 has added important additions (thanks for Claudio Inal from Universidad Tecnica Federico Santa Maria, Chile):- Explicit separate classes for static motorbike (ms), static cars (cs) and static buses/large vehicles (bs). This way, we provide B and C datasets with 6 classes (maybe useful to see if detection methods behave differently for static and moving objects).
- Then, the annotations of static vehicles were "merged" to their corresponding "main" classes, e.g. static motorbike objects were simply re-labelled as motorbikes and so on, thus creating new B and C datasets with 3 classes. Note: data and results for these two kinds of data (3-class and 6-class) are different to what we reported in our 2025 Drones paper.
- The above results in 4 separate datasets (all in Ultralytics YOLO format):
- B with 3 classes
- B with 6 classes
- C with 3 classes
- C with 6 classes
- We also provide frame-to-frame unique object ids for these datasets to help researcher experiment with tracking methods. These data is given in two formats (Note: please contact us if you need access to these data):
- XML pseudo Pascal VOC format where we have added attributes "track_id" (a unique number for each vehicles as they go from one frame to the next) and "occlusion" (always the same!, for future annotation refinement), one file per image
- MOT format (as per the MOT challenge). A single file of comma separated rows for each image: frame_id, track_id, top_left_x, top_left_y, width, height, confidence (always 1), class_id, visibility. These files have been generated from the pseudo Pascal VOC files.
Data Partitions
This refers on how the data is partitioned into training, validation and evaluation (test). We do not mix B with C as one of the purposes it to check generalisation (see above). Originally, we "naively" created such partitions by random selection of frames. This however tends to "inflate" evaluation metrics because the trained model had been exposed to similar images. This is aggravated by the fact that images come from temporal sequences (videos). In our Drones paper we showed the effects of various partitions and have now fixed the data with what we called SequentialGap300, meaning that the video sequence is used with a given number of sequential frames for training, followed by a gap of 300 (dropped) images, followed by a sequence of validation images, followed by a gap of 300 (dropped) images and finally a sequence of frames used for evaluation.In version 1, we provided various possible partitions and a rather confusing explanation of how to partition the overall data. To avoid confusion to make sure everyone uses the same data we now provide already partitioned data.
Downloading the data
Note
for Chrome/Chromium users: Chrome's automated
scanner may flag some of the files in this page as "uncommon
download." The files are perfectly safe. If blocked, please
right-click the link and select "Save link as...",
use Firefox, or download via terminal: wget [URL]
The YOLO-annotated data can be downloaded using this link (17.1GB, you will need credentials that can be obtained by contacting Prof. Sergio A. Velastin). Once downloaded and extracted, you will find the following directory structure (it follows Ultralytics data structure for each of the 4 datasets. Note: as the images are the same for the 3-class and 6-class cases, the images subdirectories for the 6-class sets are empty, to reduce the size of the download):
UTUAV_B_C_3and6class
├── B_Sequential_Gap300-3class
│ ├── evaluation
│ │ ├── Annotations
│ │ ├── images
│ │ └── labels
│ ├── training
│ │ ├── Annotations
│ │ ├── images
│ │ └── labels
│ └── validation
│ ├── Annotations
│ ├── images
│ └── labels
├── B_Sequential_Gap300-6class
│ ├── evaluation
│ │ ├── Annotations
│ │ ├── images
│ │ └── labels
│ ├── training
│ │ ├── Annotations
│ │ ├── images
│ │ └── labels
│ └── validation
│ ├── Annotations
│ ├── images
│ └── labels
├── C_Sequential_Gap300-3class
│ ├── evaluation
│ │ ├── Annotations
│ │ ├── images
│ │ └── labels
│ ├── training
│ │ ├── Annotations
│ │ ├── images
│ │ └── labels
│ └── validation
│ ├── Annotations
│ ├── images
│ └── labels
└── C_Sequential_Gap300-6class
├── evaluation
│ ├── Annotations
│ ├── images
│ └── labels
├── training
│ ├── Annotations
│ ├── images
│ └── labels
└── validation
├── Annotations
├── images
└── labels
The lists of training/validation/evaluation filenames for B and C can be downloaded from here.
And use this link to download the pseudo-PascalVOC (XML) and MOT annotations. The XMLs contain the object locations and unique object ids (for tracking) for the complete B and C datasets. The same is the case for the MOT (MOT challenge format, first class id (motorbikes) is set to 1). It also contains the MOT files just for the evaluation partitions.
Hyperparameters
To try reproducing our results for YOLO and ACD_DETR, you can use this YOLO configuration file.Possible problems training with Ultralytics
💡 Troubleshooting: older nvidia cards
I have been using Titan V GPU (which is a bit old but
reasonably fast). The latest version of Ultralytics (8.4.90 at
the time of writing) is very memory hungry and perhaps memory
leaky with this GPU. Newer GPUs might not have this issue. The
way it worked for me:
💡 Troubleshooting:
Training running on CPU instead of GPU? If your execution log says CPU instead of CUDA, your system's NVIDIA driver is
likely too old for the default PyTorch installation. You can
fix this by matching your PyTorch version to your driver.
E.g. run this command inside your environment: pip install torch
torchvision torchaudio --index-url
https://download.pytorch.org/whl/cu121 --force-reinstall
Ultralytics Database file
As an example, the 6-class B database file will look
something like this:
path: YOUR_DIRECTORY/B_Sequential_Gap300_6-class/
train: training
val: validation
test: evaluation # the full evaluation set
# number of classes
nc: 6
# class names (one letter else visualisation is cluttered), s="static"
names: ['m','c','b','ms','cs','bs']
Sample command to train a YOLO model:
# S.A. Velastin Sept 2025
# UTUAV training B dataset, N
yolo mode= train cfg= YOUR_DIRECTORY/default_felipe.yaml data= YOUR_DIRECTORY/B_Sequential_Gap300_6-class.yaml imgsz= 1024 batch= 10 epochs= 100 model= yolo11n.pt exist_ok= True project= YOUR_RUNS_DIRECTORY name= Coco_100e_1024_v11n
#(to train from scratch, not from pre-trained Coco, use model= yolo11n.yaml)
ACD_DETR
To train with ACD-DETR first install it ACD-DETR (using a conda enviroment):clone https://github.com/TYrant-TY/ACD-DETR
cd to the new directory
Setup a conda environment (sergio_rt) as explained in the repo
python setup.py install
pip install psutil # else command “yolo” fails
pip install ipython # more friendly python console
To use an ACD-DETR “N” model (for fair comparison with YOLO N models), copy the file ultralytics/cfg/models/rt-detr/ACD-DETR.yaml to ultralytics/cfg/models/rt-detr/ACD_DETR-n.yaml and modify to (adding the scales for an N model):
scales: # model compound scaling constants, i.e. 'model=yolov8n-cls.yaml' will call yolov8-cls.yaml with scale 'n'
# [depth, width, max_channels]
n: [0.33, 0.25, 1024] # Add this for YOLOv11 N comparison (SAV/Gemini)
l: [1.00, 1.00, 1024]
Please see under code below for a script to train with ACD_DETR. Please feel free to contact me if there is something missing in these instructions.
Code
For convenience (but without guarantees!) we provide a set of scripts and commands we have used to generate our result (credentials are needed to download).- The *.sh files are normally used to train a model. Please modify according to your paths. Also note that we have used the convention that e.g. B_Sequential_Gap_300 refers to the 3-class data and B_Sequential_Gap_300Stat refers to the 6-class data!
- train_SAV.py is the script to train an ACD_DETR
model (apologies that data paths are hard coded), to
be executed within an ACD_DETR (conda) environment
- GenPreds.py is the script to generate the predictions (as YOLO labels) and metrics for a model. Run from an Ultralytics (conda) environment. It defaults to using the evaluation partition. For example: python GenPreds.py -m MODELPATH -c CONFIG_PATH -d DATAPATH -p DETECT_RUNS_PATH -n NAME --imgsz 1024
- GenPreds_DETR is the equivalent for ACD_DETR, to be executed within an ACD_DETR (conda) environment
Please contact us if there are any issues. We also
provide a
set of instructions to help train and test models.
Results
In all the experiments reported here, we have used "N"
models, trained for 100 epochs, imgsz=1024, using a
Titan V GPU card under Linux Mint 22 with conda. These
are summarised in this
spreadsheet (the bold figures correspond to the
best prediction results vertically i.e. comparing models
trained with the same starting weights).
For any queries related to these datasets please
contact Jorge
Espinosa or Sergio
A Velastin